
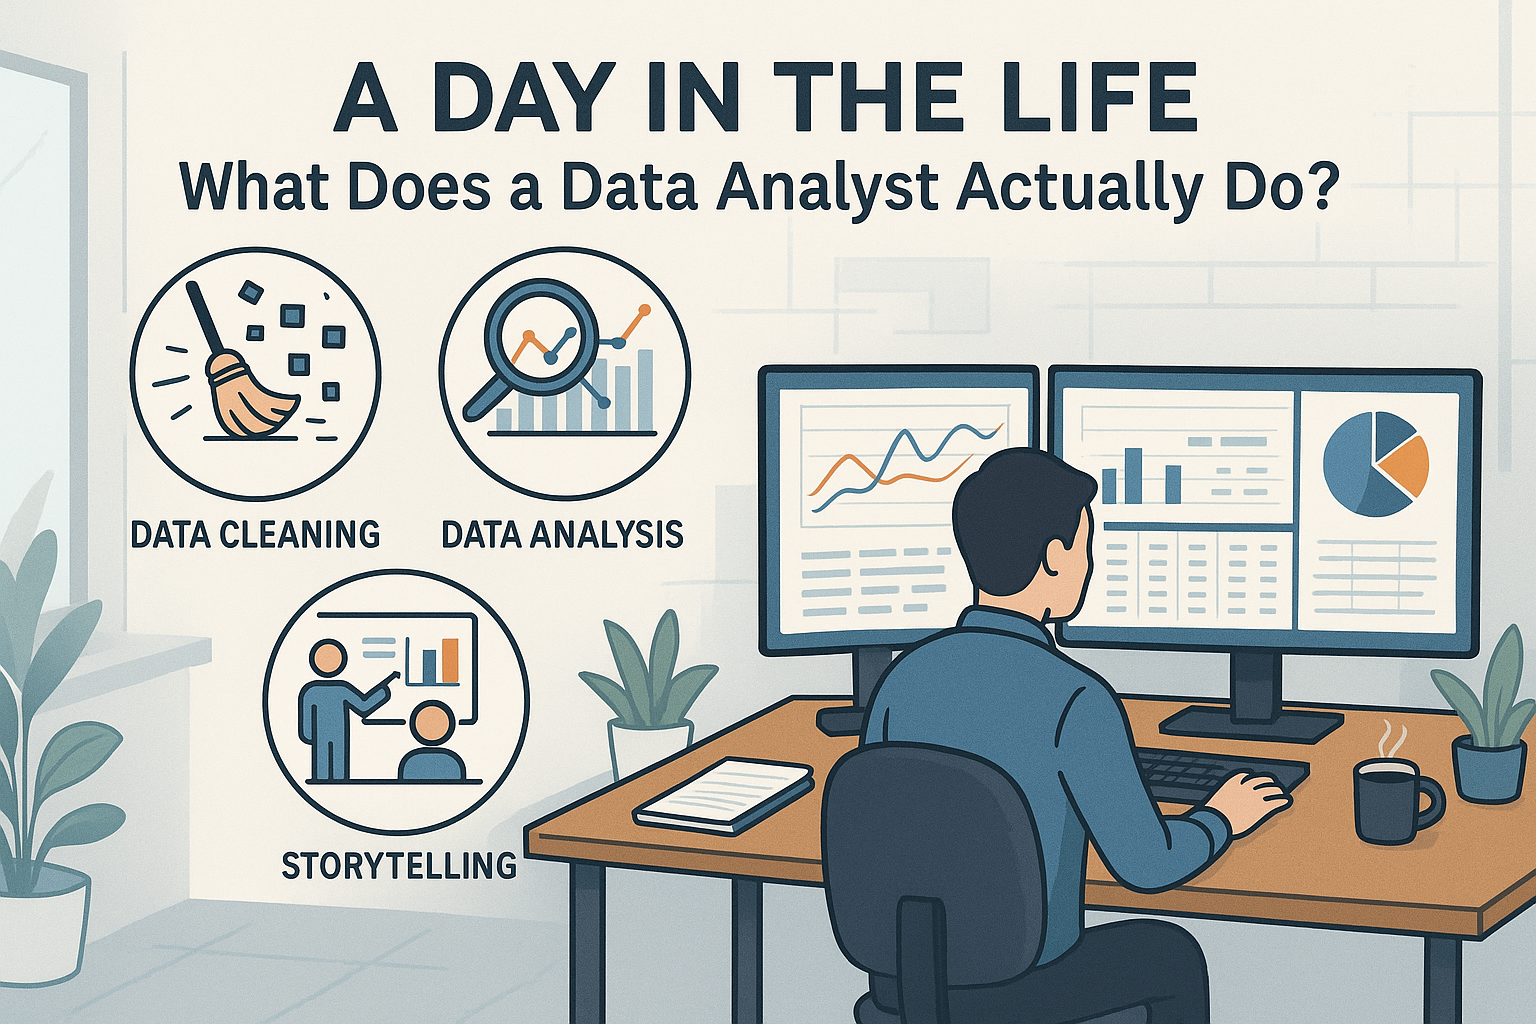
A Day in the Life: What Does a Data Analyst Actually Do?
"Data is the new oil." It’s a phrase we hear constantly. Companies are scrambling to hire professionals who can make sense of the massive amounts of information they collect every day. As a result, the role of the Data Analyst has become one of the hottest, most sought-after careers in the modern job market.
But for all the hype, there is a lot of confusion about what this job actually entails. Is it just staring at spreadsheets all day? Is it complex coding like a software engineer? Do you need to be a math genius?
If you are considering this career path, relying on a generic job description isn't enough. You need to understand the reality of the role—the good, the bad, and the messy. It’s not just about making pretty charts; it’s about being a detective, a janitor, and a storyteller all rolled into one.
This guide takes you behind the scenes. We will break down the typical day of a Data Analyst, uncover the core responsibilities that don't always make it into the job posting, and help you decide if this analytical adventure is the right fit for you.
The Core Loop: The 4 Pillars of the Job
Before we look at the schedule, we need to understand the workflow. A Data Analyst's job isn't linear; it's a cycle.
[Image of Data Analysis Process Cycle]
- Data Collection (The Hunt): Finding the data you need. This might mean querying a database using SQL, scraping a website, or asking the sales team to send over their spreadsheets.
- Data Cleaning (The Grunt Work): This is the reality check. Real-world data is messy. It has duplicates, missing values, and typos. A massive chunk of your time (often 60-70%) is spent cleaning and prepping this data to make it usable.
- Analysis (The Detective Work): Once the data is clean, you explore it. You look for trends, patterns, and anomalies. You ask, "Why did sales drop on Tuesday?" or "Which customer segment is churning the fastest?"
- Visualization & Storytelling (The Art): Numbers alone don't persuade people. You must translate your findings into charts, dashboards (using tools like Tableau or Power BI), and presentations that non-technical stakeholders can understand.
A Typical Daily Schedule
While every day is different, here is what a realistic Tuesday might look like for a mid-level Data Analyst.
09:00 AM – The Health Check You start the day by checking your automated dashboards. Did the daily sales report update correctly? Are there any glaring anomalies in the overnight traffic data? If a "pipeline" (the automated flow of data) broke, you need to fix it immediately before the marketing team starts asking questions.
10:00 AM – The "Ad-Hoc" Request A Product Manager pings you: "Hey, we're thinking of changing the button color on the app. Can you tell me how many people clicked the blue button vs. the red one last month?" This is an ad-hoc request. You pause your long-term project to write a quick SQL query to pull this specific number.
11:00 AM – Deep Work (Data Cleaning) You dive into your main project: analyzing customer retention for the past year. You pull the raw data, but it’s a mess. Some dates are formatted as DD/MM/YYYY, others as MM/DD/YYYY. You spend the next two hours using Python (Pandas) or advanced Excel functions to standardize the formats, remove duplicates, and fill in missing values. It’s tedious, but essential.
02:00 PM – The Analysis The data is clean. Now the fun begins. You run statistical analyses to see if there's a correlation between customer support tickets and cancellations. You find a pattern: customers who wait more than 5 minutes on hold are 3x more likely to cancel. This is an "insight."
03:30 PM – The Storytelling (Stakeholder Meeting) You meet with the Head of Customer Success to present your findings. You don't show them your code or your raw spreadsheet. You show them a clean Tableau dashboard you built that visualizes the "Wait Time vs. Cancellation Rate" trend. You explain the business impact clearly: "If we reduce wait times by 2 minutes, we could save ₹10 Lakhs in lost revenue next quarter."
05:00 PM – Documentation and Upskilling You document the code you wrote so others can understand it later. You might spend the last 30 minutes reading a blog about a new feature in Power BI or practicing a new Python library on a platform like JobPe's Coding Practice to stay sharp.
The Toolbox: What You Need to Know
To survive this day, you need a specific set of hard skills. * Excel/Google Sheets: The bread and butter. You must be a master of VLOOKUP, Pivot Tables, and formulas. * SQL (Structured Query Language): The industry standard for talking to databases. You cannot be a modern Data Analyst without knowing how to write SQL queries to extract data. * Visualization Tools: Tableau, Power BI, or Looker. These help you turn numbers into pictures. * Programming (Optional but Recommended): Python or R. These are used for more advanced cleaning and statistical analysis.
The "Soft" Skills That Get You Promoted
The technical skills get you hired, but these soft skills make you successful: * Curiosity: You need an innate desire to dig deeper. When you see a number that looks wrong, you don't ignore it; you investigate it. * Communication: You are a translator. You speak "Data" and you speak "Business." Your ability to explain complex technical findings to a non-technical marketing manager is your most valuable asset. * Skepticism: You don't blindly trust data. You always ask, "Is this data source reliable? Does this result make sense?"
Is This Career Right For You?
Yes, if: * You love solving puzzles and getting to the "why" behind a problem. * You enjoy working independently for long stretches (the cleaning/analysis phase). * You get satisfaction from bringing order to chaos.
No, if: * You hate detail-oriented work (one wrong comma in code breaks everything). * You prefer roles where you are constantly interacting with people all day. * You think the job is only about making predictions (that's Data Science, a different field).
Conclusion: The Detective of the Business World
A Data Analyst is the eyes and ears of a modern company. You provide the evidence that leaders need to make smart decisions. It is a role that offers high impact, excellent job security, and a fascinating variety of problems to solve.
If this day-in-the-life sounds appealing, you're on the right track. Start by building your foundation in Excel and SQL. Create a portfolio of projects to show you can handle the messy reality of data. And when you're ready to apply, use the JobPe Resume Builder to showcase your analytical prowess effectively.
For more resources to help you launch your data career, https://jobpe.com.

Creative Content Writer
More from Debojyoti Roy
Beating the Applicant Tracking System (ATS): The Ultimate Guide to Getting Past the Bot
Is your resume getting rejected instantly? It might be the ATS. Learn how Applicant Tracking Systems work, how to format your resume to beat the bot, and the keyword strategies that get you noticed.
2025-12-10

Mastering the Cold Email: How to Land a Job Without Applying Online
Tired of the "black hole" of online applications? Learn the art of the cold email. We provide strategies, subject lines, and templates to reach hiring managers directly.
2025-12-10

How to Ask for a Raise (Without Being Awkward): A Step-by-Step Guide
Don't wait for your annual appraisal. Learn the strategic way to ask for a raise, build your business case, and use our scripts to get the salary hike you deserve.
2025-12-10

The First 90 Days: A Strategic Plan to Impress Your New Boss
Your first 3 months in a new job determine your reputation. Use our 30-60-90 day plan to secure early wins, build relationships, and pass probation with flying colors.
2025-12-09
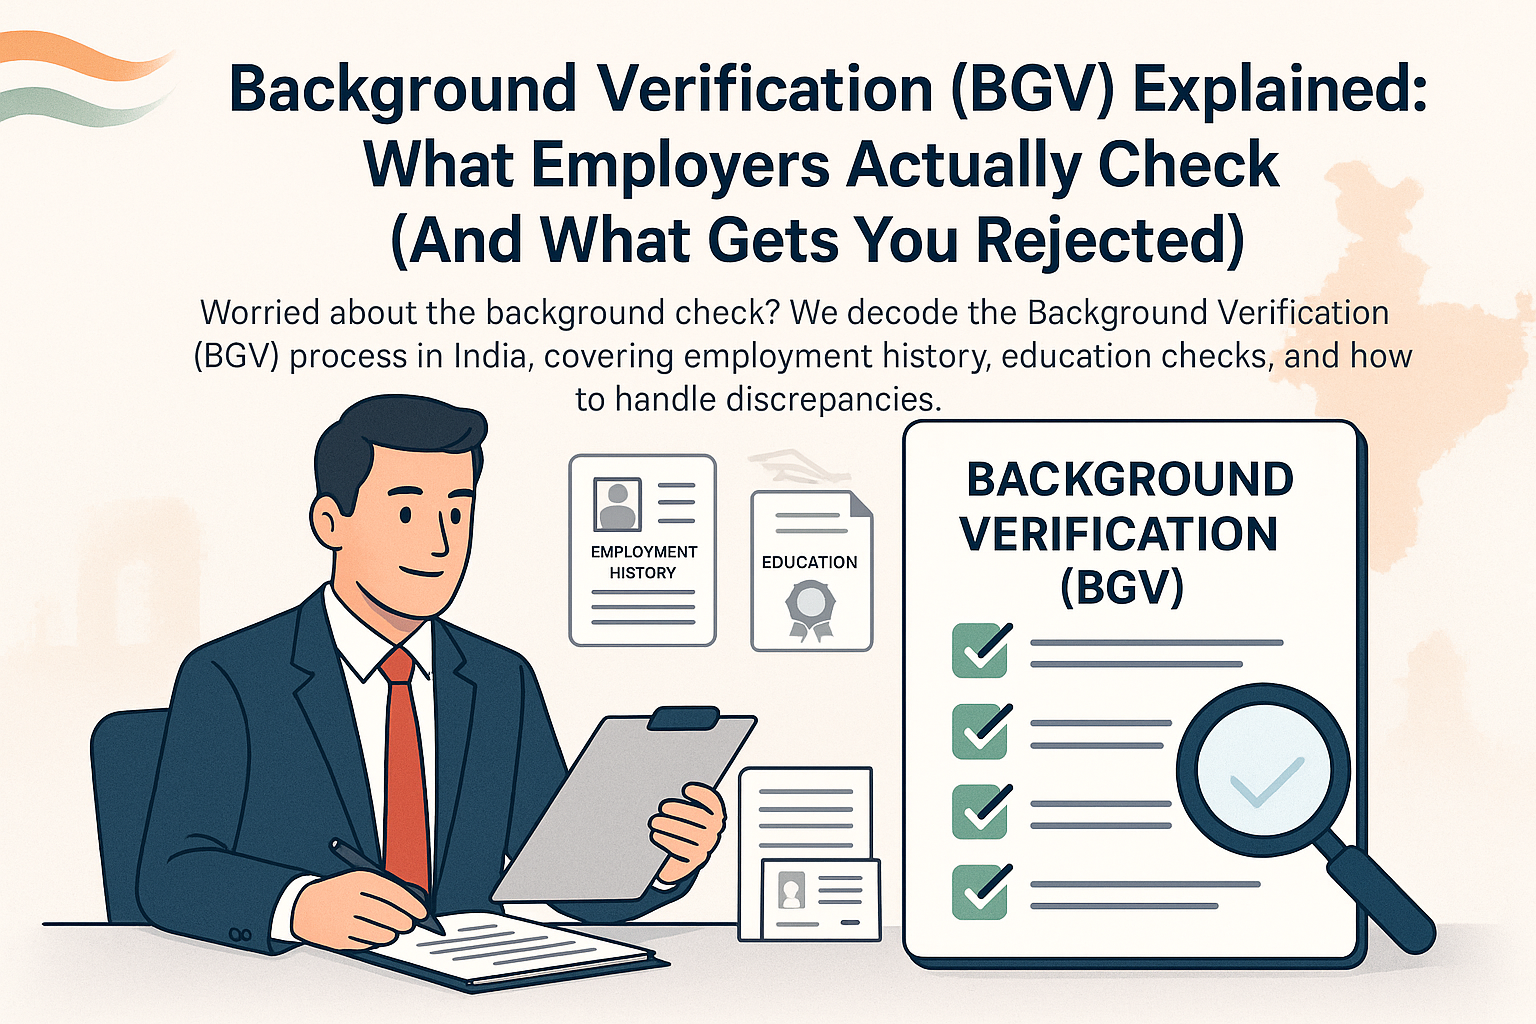
Background Verification (BGV) Explained: What Employers Actually Check (And What Gets You Rejected)
Worried about the background check? We decode the Background Verification (BGV) process in India, covering employment history, education checks, and how to handle discrepancies.
2025-12-09